Calculating Success with KPI Modelling
KPI modelling lets utilities identify and then confirm the effectiveness of operational changes

Data integrations identify correlation between pressure events and operational activity
When Syrinix client Missouri American Water needed to import SCADA data from the utility’s other instrumentation, Syrinix developed a powerful new feature that would benefit clients for years to come.
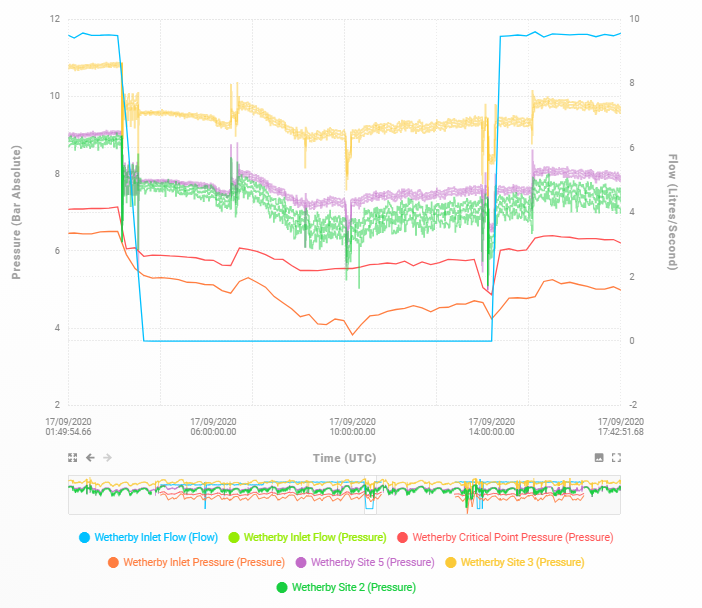
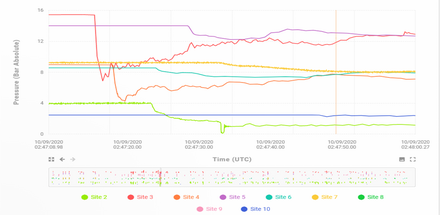
By overlaying third-party data with PIPEMINDER’s pressure monitoring data, the RADAR cloud-based platform allows users to look for a correlation between pressure events and network operational activities.
By overlaying network events on top of pressure data, a utility can confidently make changes such as slowing pump ramps, increasing valve opening and closing times, and adjusting pressure reducing valves to reduce transient activity.
Reducing transient activity calms the network, reduces the number of leaks and bursts, and leads to long asset lifetimes.
Third-party data can be imported into RADAR in two ways. In the first method, an hourly SCADA data feed - pump starts, stops, flow, pressure, valve position – is manually uploaded to RADAR, visible as time-series data on the plots for a site. Manual upload of third-party data is available to all RADAR users.
The second, and more advanced option, involves setting up RADAR to automatically import SCADA data which is then automatically overlaid onto pressure data and displayed side by side on the screen.

It would be of real benefit to have third-party data from more of our customers so that we can provide even more accurate analysis of their network activity.”
While many companies pull data from different sources to make more intelligent decisions about network operations, the RADAR platform is unique in pulling together powerful information in a simple, intuitive, easy-to-use display that can be accessed anywhere.
By adding third-party data to the pressure monitoring data from PIPEMINDER, RADAR can provide even more valuable data to users.
Including SCADA data allows transient events to be compared in time against network activity caused by customer events. If Syrinix captures a big negative transient at 12:36 PM, for example, and SCADA data shows that the utility had an unscheduled pump stop at the same time, a correlation can easily be seen on the screen.
With this intelligence, utilities are empowered to make cost- and time-saving decisions that calm their network and prolong the life of equipment and infrastructure.
SCADA import is available to all RADAR users. Contact your Syrinix support team to learn more.


KPI modelling lets utilities identify and then confirm the effectiveness of operational changes

‘Total’ or ‘static’ head pressure view provides enhanced network intelligence

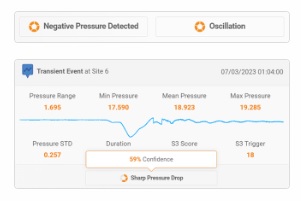
Newly detected transient events are run through multiple levels of data analysis to identify features in the event data.
Leave your details and we will be in touch.