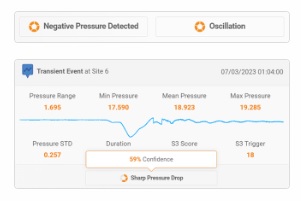
Automated Transient Labelling
Newly detected transient events are run through multiple levels of data analysis to identify and label features in the event data.

Syrinix is always working to provide utilities with the most valuable data gathering resources for making intelligent network decisions. Syrinix’s deployment planning tool allows utility engineers to optimize where units should be deployed to maximize the coverage provided for pressure transient monitoring and network management and analysis.
The tool, managed by a Syrinix service consultant, simulates different transient event sizes in a targeted network and calculates wave propagation across multiple proposed locations. As an event travels across a network, the tool looks at pressure wave attenuation and predicts transmitted and reflected waves for dissimilar joints and junctions.
When running simulations, the deployment planning tool uses 2 GIS vector layers, lines (pipes) and points (locations).
The RADAR software produces a map with color-coded pipes to show the extent of monitoring coverage in that area. The darker the red color, the better coverage provided. The examples below are of multiple simulations that have been run showing how the data changes as pipes and locations are adjusted in each simulation.
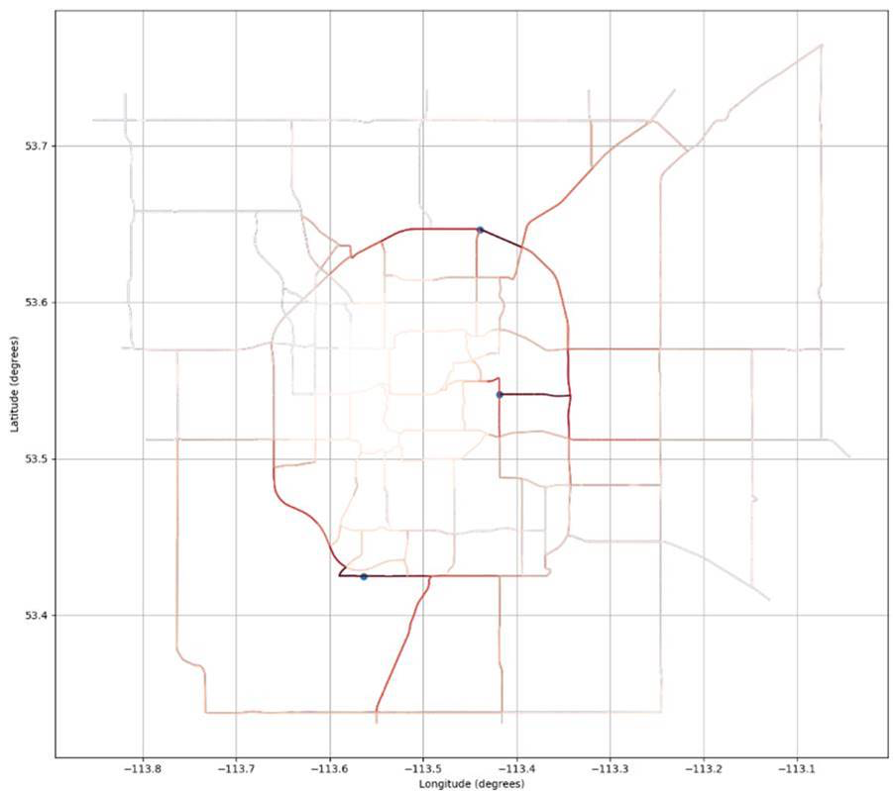
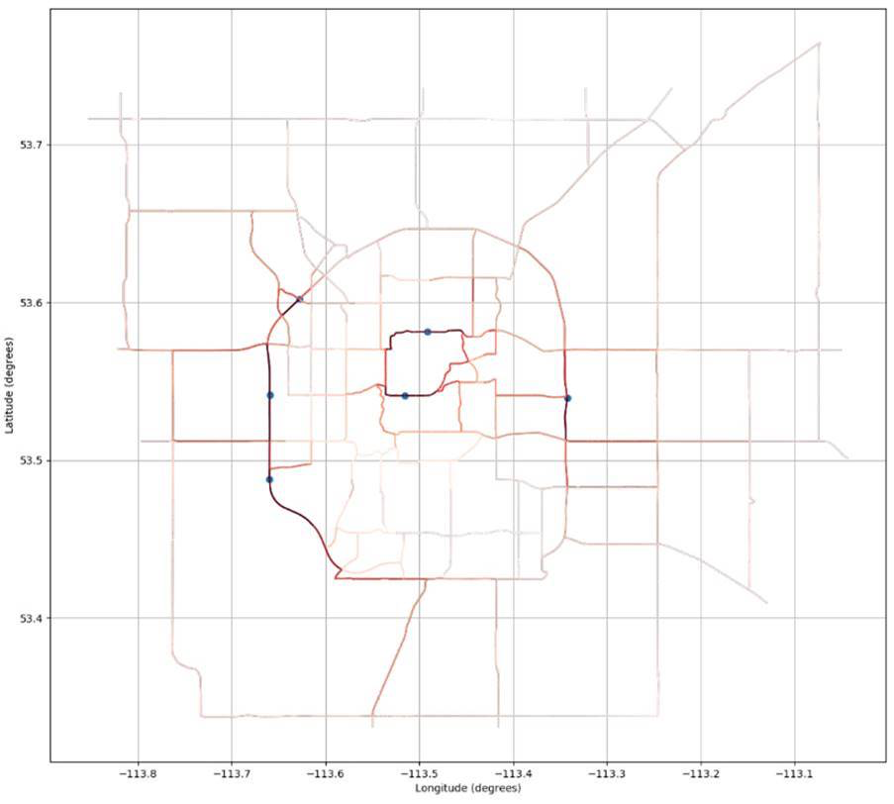


It is critical that users maximize the benefit they receive from Syrinix units whilst also saving time and money. This tool enables Syrinix to simulate several deployment scenarios using different units and locations, verifying the coverage of the network for water utility customers.
With the Syrinix deployment planning tool, water utilities can focus on monitoring their networks effectively without valuable in-house time taken assessing where to deploy units. With the Syrinix deployment planning tool, water utilities can move quickly to confidently determining what actions to take to optimize their network operations, saving time and money.
To learn more about how your utility could benefit from Syrinix deployment planning, contact us at info@syrinix.com.

Newly detected transient events are run through multiple levels of data analysis to identify and label features in the event data.
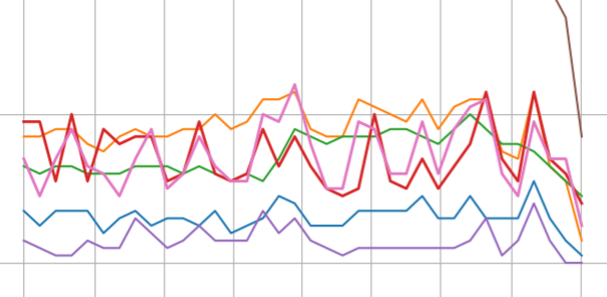
KPI modelling lets utilities identify and then confirm the effectiveness of operational changes
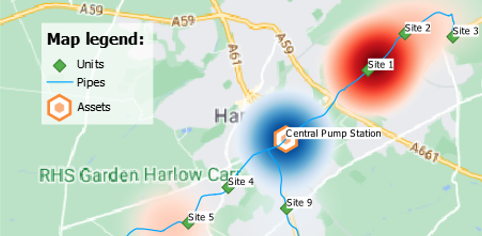
Heat mapping helps utilities quickly identify problems so they can prioritize network action
Leave your details and we will be in touch.